I asked Goose “how are you?” and it took 14 seconds to answer.
That got me wondering: why did it take so long? Was it the model? The network? The agent itself?
I decided to try and find out. Goose has built-in OpenTelemetry support, so it was easy enough to wire it up to Jaeger for distributed tracing. I also added ClickHouse so the traces would survive a restart.
Stack
My stack consisted of three components:
-
Goose, a general-purpose AI agent hosted by the Agentic AI Foundation (AAIF). It’s open source, runs locally, connects to a model provider of your choice (I used OpenRouter), and supports reusable recipes for repetitive tasks.
-
Jaeger, an open source, distributed tracing platform. It provides a framework to monitor and troubleshoot distributed workflows, identify performance bottlenecks, and trace root causes of errors.
-
ClickHouse, a high-performance, column-oriented database for real-time analytics and observability. It’s open source, handles large volumes of data efficiently, and is natively supported in Jaeger.
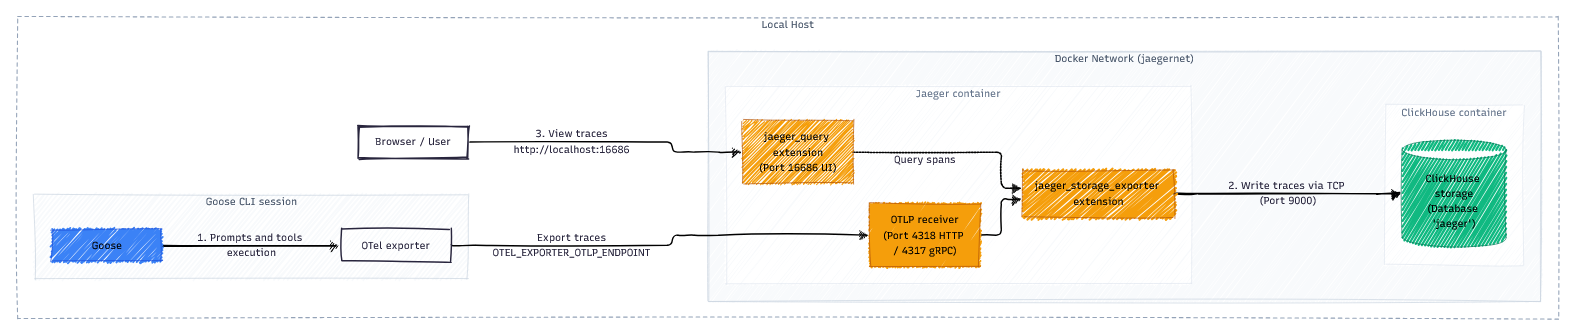
Goose is the agent. Jaeger provides deep observability. ClickHouse stores the results.
Here’s how these three components connect:
Goose
I already had Goose installed and configured, so I didn’t need to set it up again. If you’re starting from scratch, installing it takes one command:
curl -fsSL https://github.com/aaif-goose/goose/releases/download/stable/download_cli.sh | bashThen, configure it to use a model provider. I used OpenRouter with a free-tier model, qwen/qwen3.8-27b:free:
goose configure
[...]
o  What would you like to configure?
|  Configure Providers
|
o  Which model provider should we use?
|  OpenRouter
[...]
◇  Select a model:
│  Enter a model not listed...
│
◆  Enter the model name:
│  qwen/qwen3.8-27b:free
│
◐  Checking your configuration...
└  Configuration saved successfully to /home/vikram/.config/goose/config.yaml
Jaeger
The commands below are the ones I used, so you can follow along if you’d like.
Once Goose was ready, the next step was to install Jaeger and connect the two. To keep things simple, I chose to use the Jaeger container image:
docker run --rm --name jaeger \
  -p 16686:16686 \
  -p 4317:4317 \
  -p 4318:4318 \
  -p 5778:5778 \
  -p 9411:9411 \
  cr.jaegertracing.io/jaegertracing/jaeger:2.21.0
This command starts Jaeger in a container, exposing Jaeger’s web dashboard on host port 16686 and Jaeger’s data collector on host port 4318.
In the same shell session, I also configured Goose to export telemetry to the Jaeger data collector endpoint:
export OTEL_EXPORTER_OTLP_ENDPOINT="http://localhost:4318"By default, the OpenTelemetry stream does not capture prompt and completion message contents. To include this in the telemetry stream, I set the following additional environment variable:
export OTEL_INSTRUMENTATION_GENAI_CAPTURE_MESSAGE_CONTENT=trueThis is optional, and because it can expose prompt and completion content in telemetry, it should only be enabled where that data can be stored and accessed appropriately.
Trace #1
With the configuration out of the way, it was time to test things out:
goose

    __( O)>  ● new session · openrouter qwen/qwen3.8-27b:free
   \____)    20260928_15 · /home/vikram
     L L     goose is ready
  ⏳ loading extensions in background...
  ╌╌╌╌╌╌╌╌╌╌╌╌╌╌╌╌╌╌╌╌ 0% 0/128k
> how are you?
  ✓ extensions ready

I'm doing well, thanks for asking! Ready to help with whatever you need — what's on your mind?
  ⏱ 14.03s
  ━╌╌╌╌╌╌╌╌╌╌╌╌╌╌╌╌╌╌╌ 5% 7k/128k
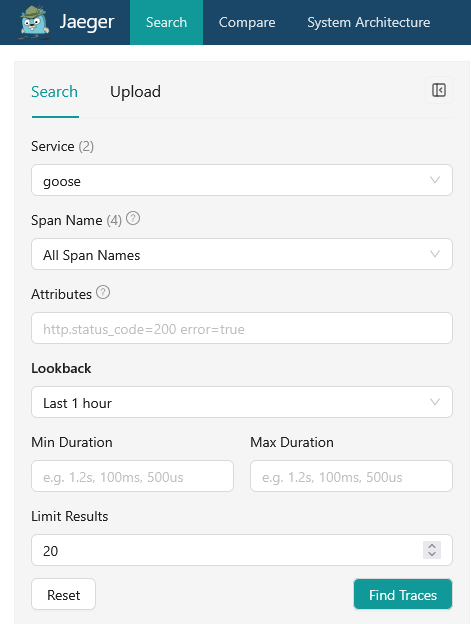
This was a simple handshake to test the integration. To see the corresponding trace in Jaeger, I opened the Jaeger web dashboard at http://localhost:16686, selected the newly minted goose service, clicked the Find traces button, and selected the most recent trace.
By default, the primary dashboard view for a trace is a nested tree of spans, representing individual units of work (like an API request, database query, or function call) arranged as a Gantt chart or waterfall view. Jaeger also records the duration of each span, so you can see which ones are taking the most time.
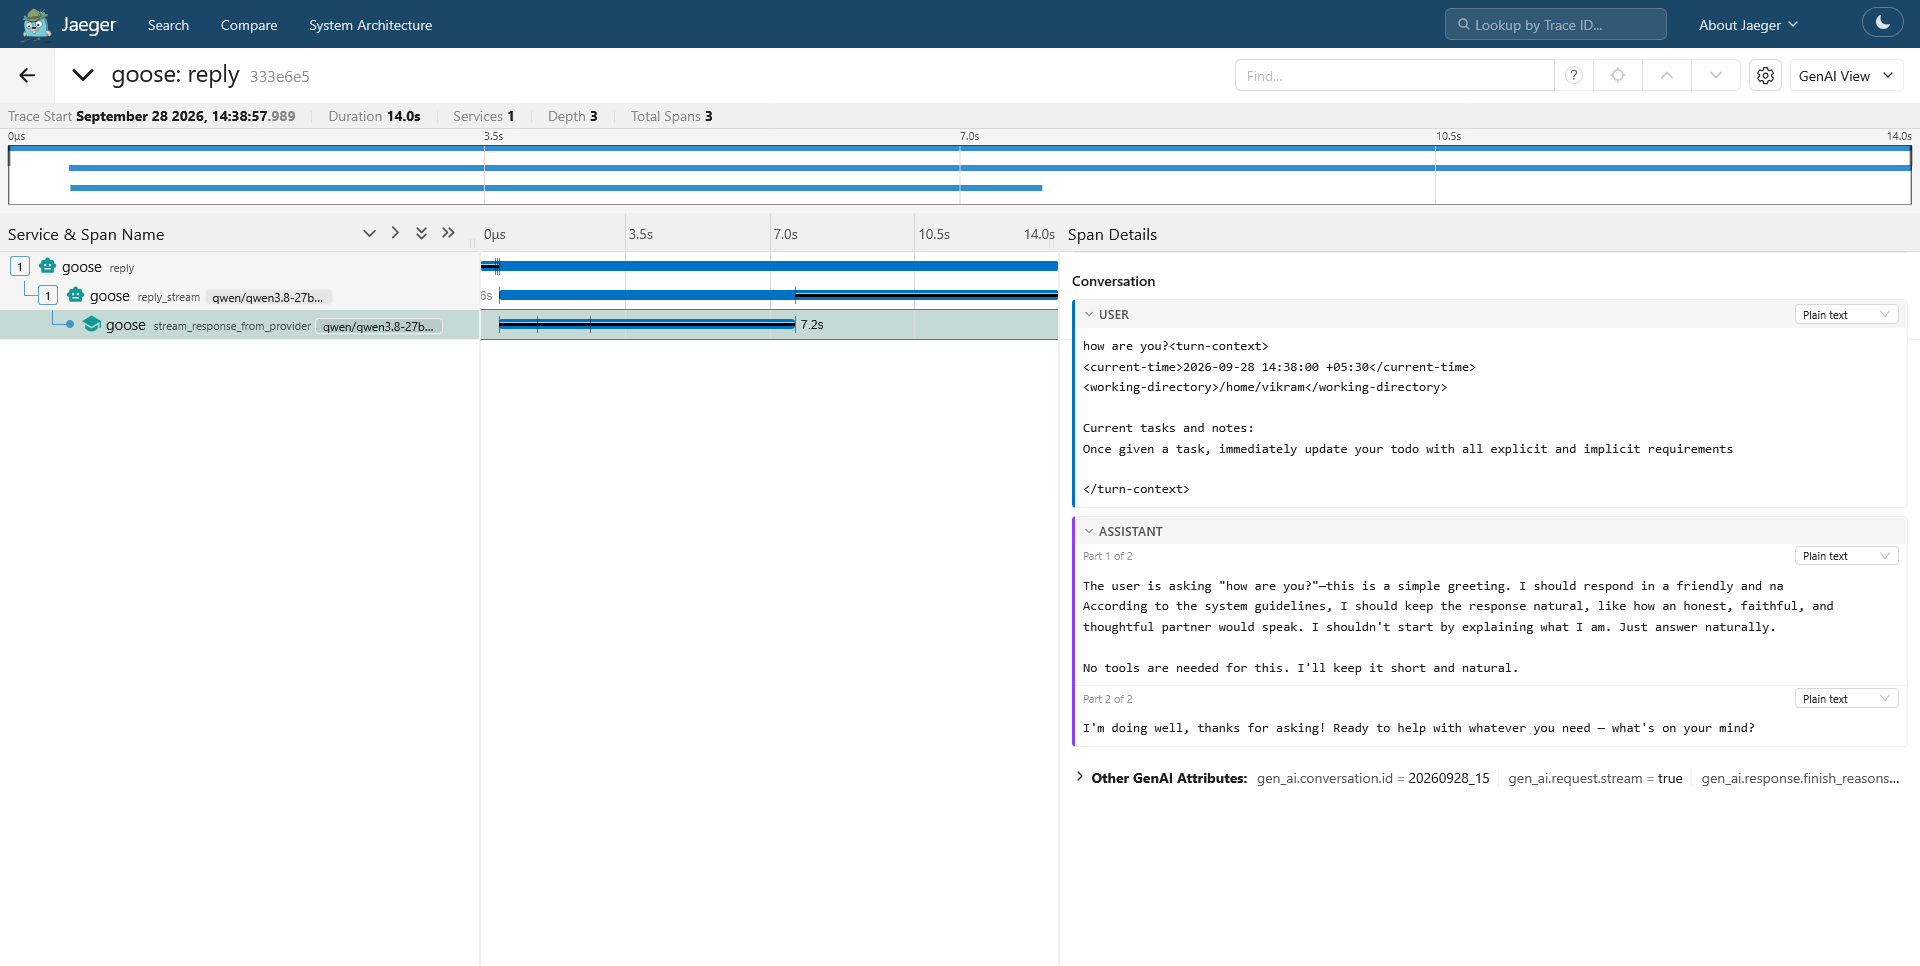
Clicking on any individual span expands it to display additional information, such as the actual request/response text, any key-value metadata, plus infrastructure details about where the code executed.
So, where did the 14 seconds go?
The trace has the answer. The entire goose: reply span took ~14 seconds, of which:
- The call to the model (
stream_response_from_provider) took ~7 seconds, about half the total.- This is because the model didn’t just reply; it also “thought” about the question (you can see this in the assistant output, which is split into two parts, a reasoning block followed by the actual answer).
- Goose also added context to my three-word question (the current time, working directory, and instructions about tracking tasks), so the model was actually processing far more than “how are you?”.
- The other ~6.5 seconds remain outside the provider call, and the reason is unclear from the trace - I’m guessing it was Goose processing the response stream.
Out of curiosity, I ran the same prompt against a different free-tier model, nvidia/nemotron-3.5-lightning:free:
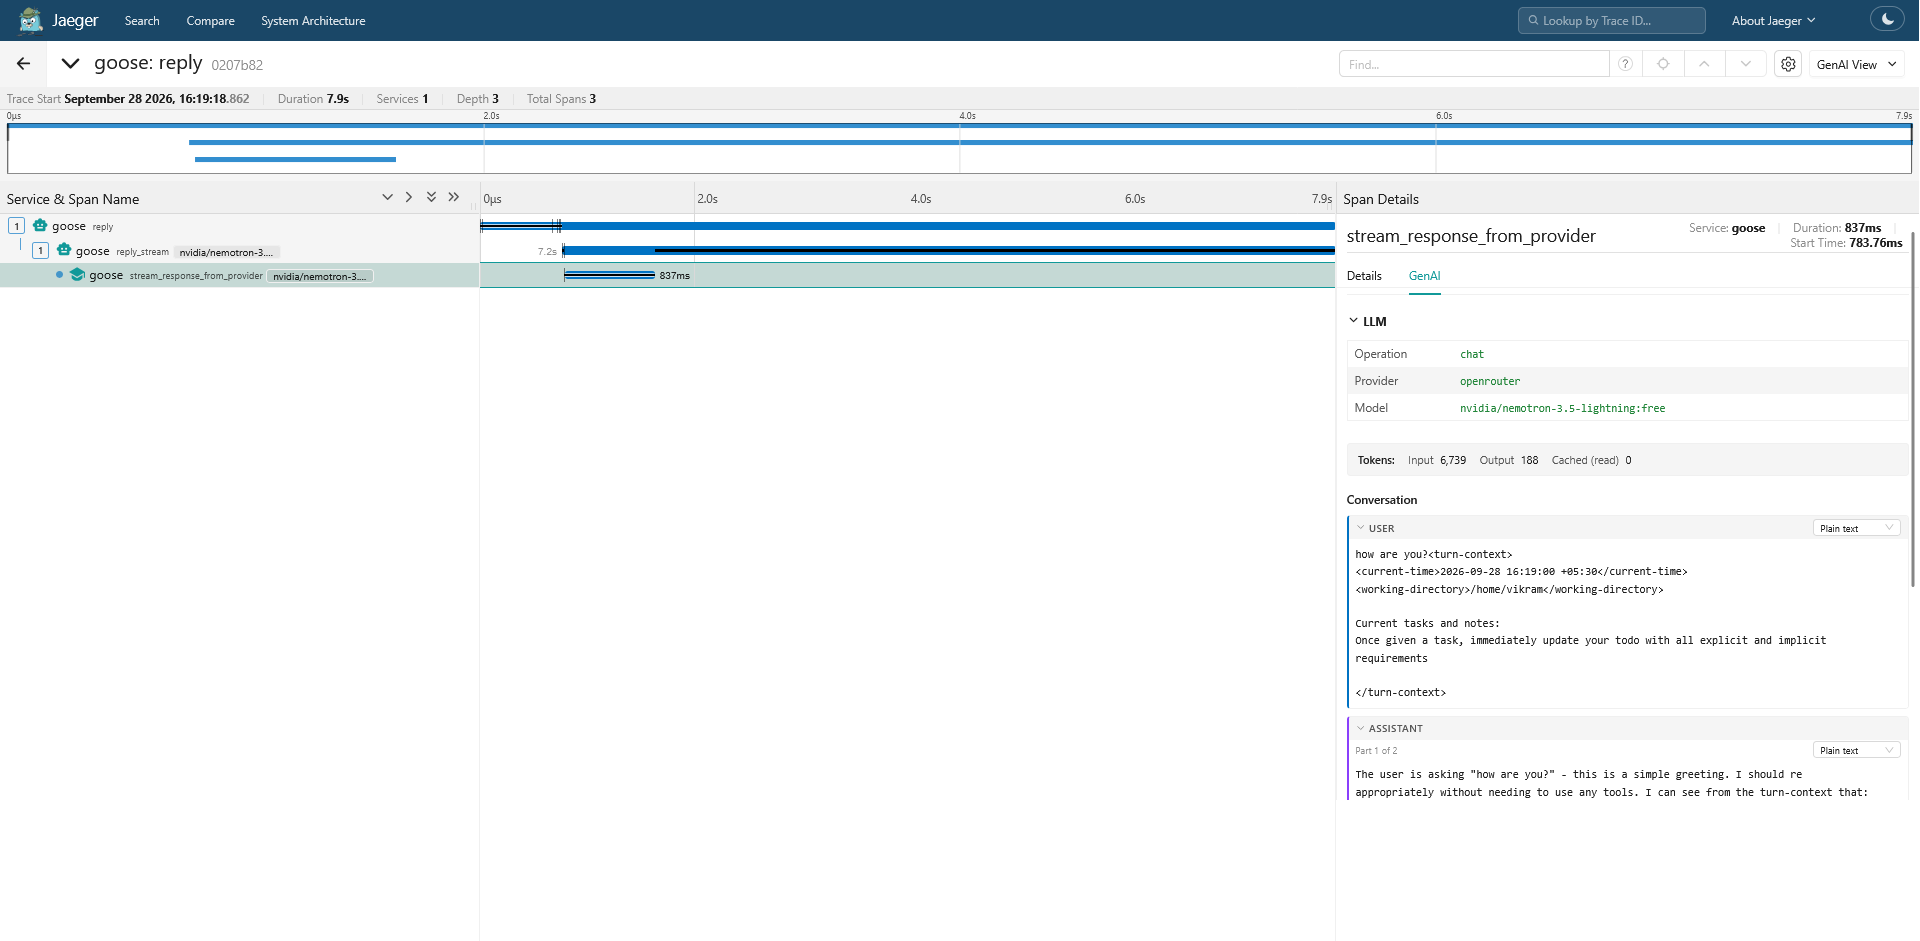
This trace showed that the reply took 7.9 seconds. The model call itself dropped from ~7 seconds to ~1 second, but there were still ~7 unexplained seconds outside the model call, similar to the first trace.
Overall, tracing showed that about half of the original ~14-second wait was the model call, and swapping in a different free model cut that significantly, to ~1 second. The remaining ~7 seconds stayed about the same, which suggests it came from Goose itself rather than the model. Either way, without the trace, I would have assumed the model was responsible for the entire ~14 seconds; turns out that it was actually responsible for only about half.
It’s worth mentioning that these are all single runs on exclusively free-tier models, so these numbers shouldn’t be taken as authoritative. Free-tier models are subject to rate limits and shared capacity, so response times can vary from run to run.
ClickHouse
This tracing setup worked well but had one problem. By default, Jaeger’s container image uses an in-memory store for collected traces. As a result, trace data is ephemeral and is lost whenever the container restarts or stops. To save trace data for a longer period, it’s necessary to configure a persistent storage option.
Enter ClickHouse, one of Jaeger’s supported storage backends. Here’s how I configured it to work with Jaeger.
-
I began by creating a common Docker network for the Jaeger and ClickHouse services:
bash docker network create jaegernet -
I deployed the ClickHouse server on the
jaegernetnetwork using its container image:bash docker run -d --rm --name clickhouse-server \ --network jaegernet \ -p 8123:8123 \ -p 9000:9000 \ -e CLICKHOUSE_USER=admin \ -e CLICKHOUSE_PASSWORD=guessme \ -e CLICKHOUSE_DEFAULT_ACCESS_MANAGEMENT=1 \ -e CLICKHOUSE_DB=jaeger \ -v clickhouse_data:/var/lib/clickhouse \ -v clickhouse_logs:/var/log/clickhouse-server \ --ulimit nofile=262144:262144 \ clickhouse/clickhouse-server:26.8.6.5This command starts the ClickHouse server, exposing the ClickHouse web dashboard on host port 8123 and the server on host port 9000. It also sets the user credentials (
admin/guessme) for accessing the dashboard and creates a database for Jaeger traces (jaeger).The
admin/guessmecredentials are illustrative and should not be used in production environments. -
I created a Jaeger configuration file in
~/jaeger-config.yamlwith the following content:yaml service: extensions: [jaeger_storage, jaeger_query, healthcheckv2] pipelines: traces: receivers: [otlp] processors: [] exporters: [jaeger_storage_exporter] receivers: otlp: protocols: grpc: endpoint: "0.0.0.0:4317" http: endpoint: "0.0.0.0:4318" extensions: healthcheckv2: use_v2: true http: jaeger_query: storage: traces: clickhouse-storage jaeger_storage: backends: clickhouse-storage: clickhouse: addresses: - "clickhouse-server:9000" database: "jaeger" auth: basic: username: "admin" password: "guessme" create_schema: true exporters: jaeger_storage_exporter: trace_storage: clickhouse-storageThis configures an OpenTelemetry collector to ingest trace data via standard OTLP endpoints (gRPC on port 4317 and HTTP on port 4318) and exports it directly to the ClickHouse database using Jaeger’s native storage extensions. It also configures Jaeger’s query extension to visualize and search persisted traces, and includes a health check for collector status.
-
Finally, I restarted Jaeger pointing it to the new network and configuration file:
bash docker run -d --rm --name jaeger \ --network jaegernet \ -p 16686:16686 \ -p 4317:4317 \ -p 4318:4318 \ -p 5778:5778 \ -p 9411:9411 \ -v $HOME/jaeger-config.yaml:/etc/jaeger/config.yaml \ cr.jaegertracing.io/jaegertracing/jaeger:2.21.0 \ --config /etc/jaeger/config.yaml -
I confirmed that both Jaeger and ClickHouse services were running:
bash docker ps --format "table {{.Names}}\t{{.Image}}\t{{.Status}}" NAMES IMAGE STATUS jaeger cr.jaegertracing.io/jaegertracing/jaeger:2.21.0 Up 2 seconds clickhouse-server clickhouse/clickhouse-server:26.8.6.5 Up 2 minutes
Trace #2
For a more realistic test, I connected Goose to Cloudflare’s MCP server and asked it an account-specific question.
The Cloudflare MCP server uses “code mode” and gives agents just two tools to work with, so this gave me a chance to observe how Goose used those tools to write code against the Cloudflare API and answer my questions.
Here’s a transcript of the Goose session:
goose

    __( O)>  ● new session · openrouter qwen/qwen3.8-27b:free
   \____)    20260928_16 · /home/vikram
     L L     goose is ready
  ⏳ loading extensions in background...
  ╌╌╌╌╌╌╌╌╌╌╌╌╌╌╌╌╌╌╌╌ 0% 0/128k
> list my websites hosted on cloudflare
  ✓ extensions ready


  ────────────────────────────────────────
  ▸ todo_write todo
    content: - [x] List websites hosted on Cloudflare
  - [ ] Query Cloudflare API for active sites/zones...


  ────────────────────────────────────────
  ▸ execute cloudflare-mcp
    code: async () => {
  const res = await cloudflare.request({ method: "GET", path: "/zones", query: { ...


  ────────────────────────────────────────
  ▸ execute cloudflare-mcp
    code: async () => {
  const res = await cloudflare.request({ method: "GET", path: "/zones", query: { ...


  ────────────────────────────────────────
  ▸ todo_write todo
    content: - [x] List websites hosted on Cloudflare
  - [x] Query Cloudflare API for active sites/zones...

Here are your websites hosted on Cloudflare:

| Website               | Plan | Status | Created      |
|-----------------------|------|--------|--------------|
[...]

That's 2 active zones on your account. Want me to do anything with them — like check DNS records, Workers, or SSL status?
  ⏱ 48.92s
  ━╌╌╌╌╌╌╌╌╌╌╌╌╌╌╌╌╌╌╌ 6% 8k/128k
Here’s the Jaeger trace for this session:
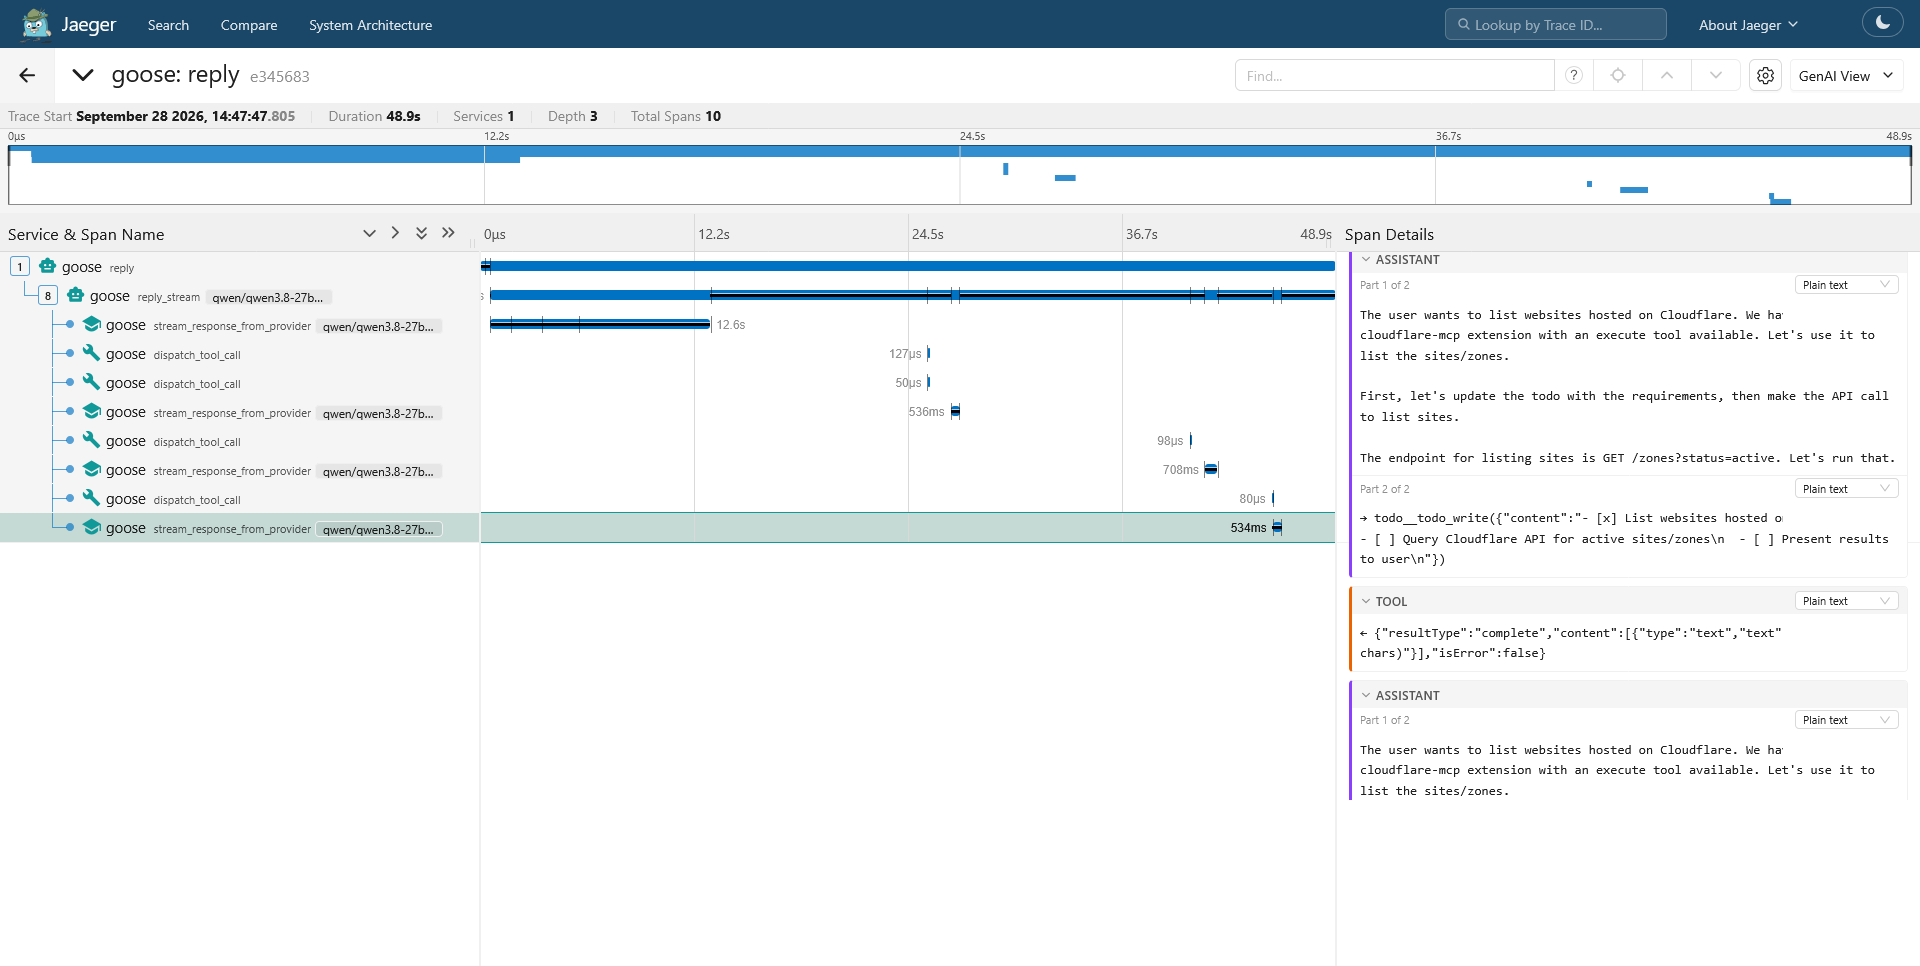
This trace shows that the reply took 48.9 seconds and produced 10 spans, alternating between model calls (stream_response_from_provider) and tool calls (dispatch_tool_call). The model decided to use the Cloudflare MCP extension, updated its todo list, wrote and executed code to query the API for active zones, and then generated the answer.
To test data persistence, I killed and restarted the containers, then checked the Jaeger dashboard again. The older trace was still there. Because both containers were started with --rm, stopping them deleted the containers; however, the traces were unaffected because ClickHouse was configured to save data in the clickhouse_data Docker volume.
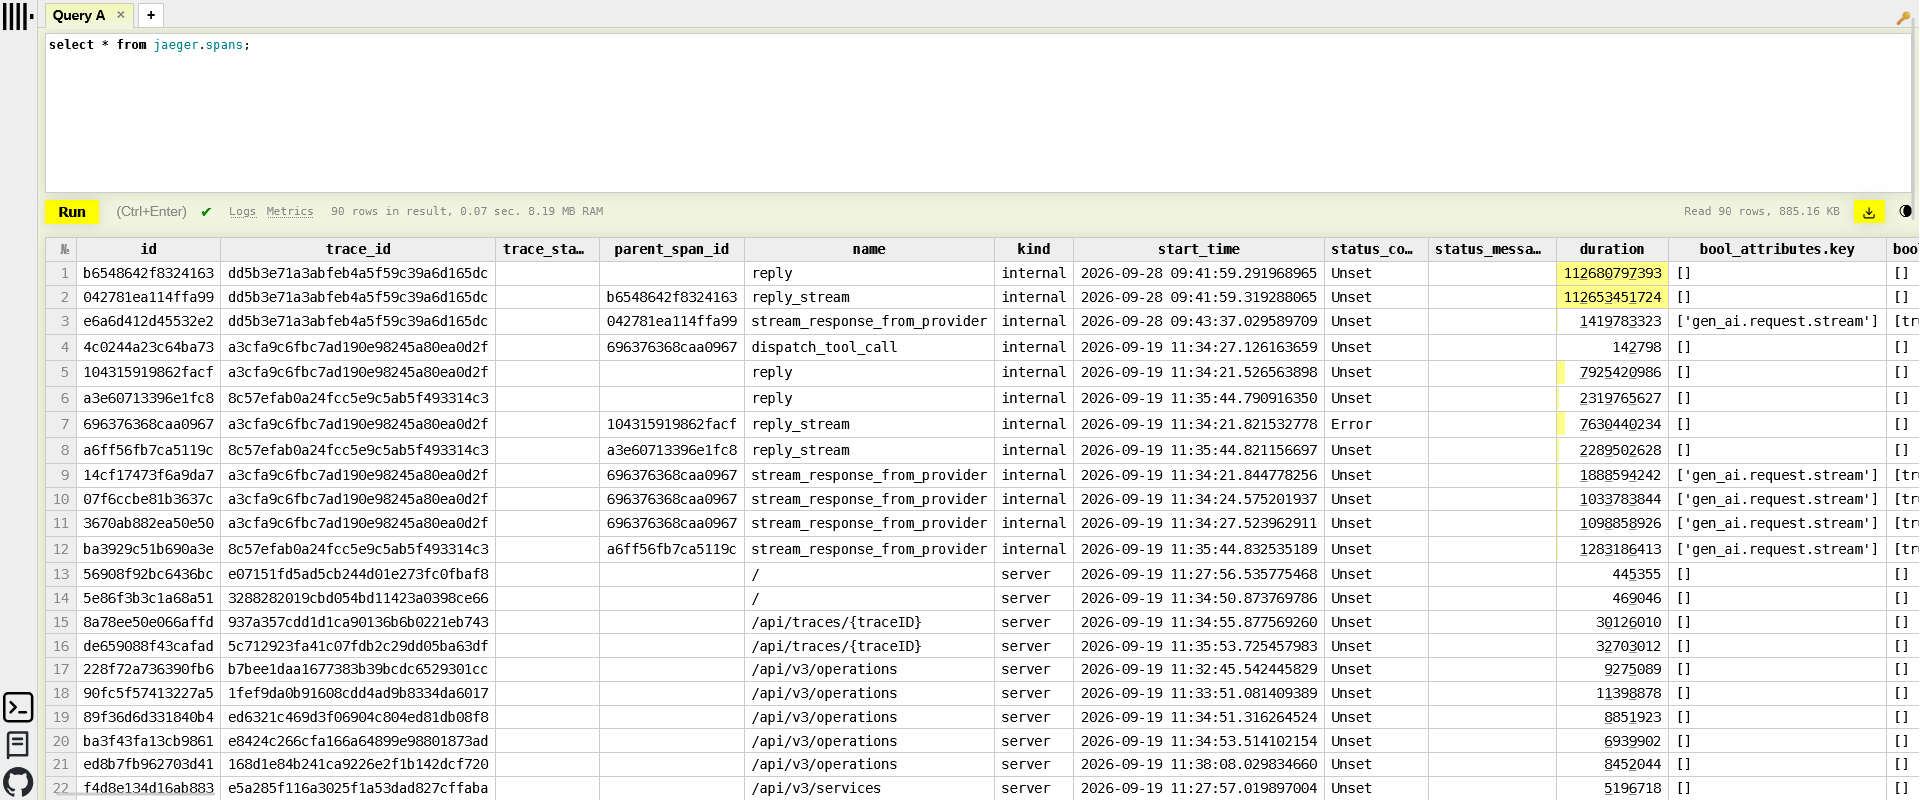
To confirm the traces were really stored in ClickHouse and not just cached somewhere, I opened the ClickHouse web dashboard at http://localhost:8123/play and queried the jaeger database directly with SQL:
ClickHouse also includes a built-in monitoring dashboard, which is available at http://localhost:8123/dashboard. Here’s what it looks like:
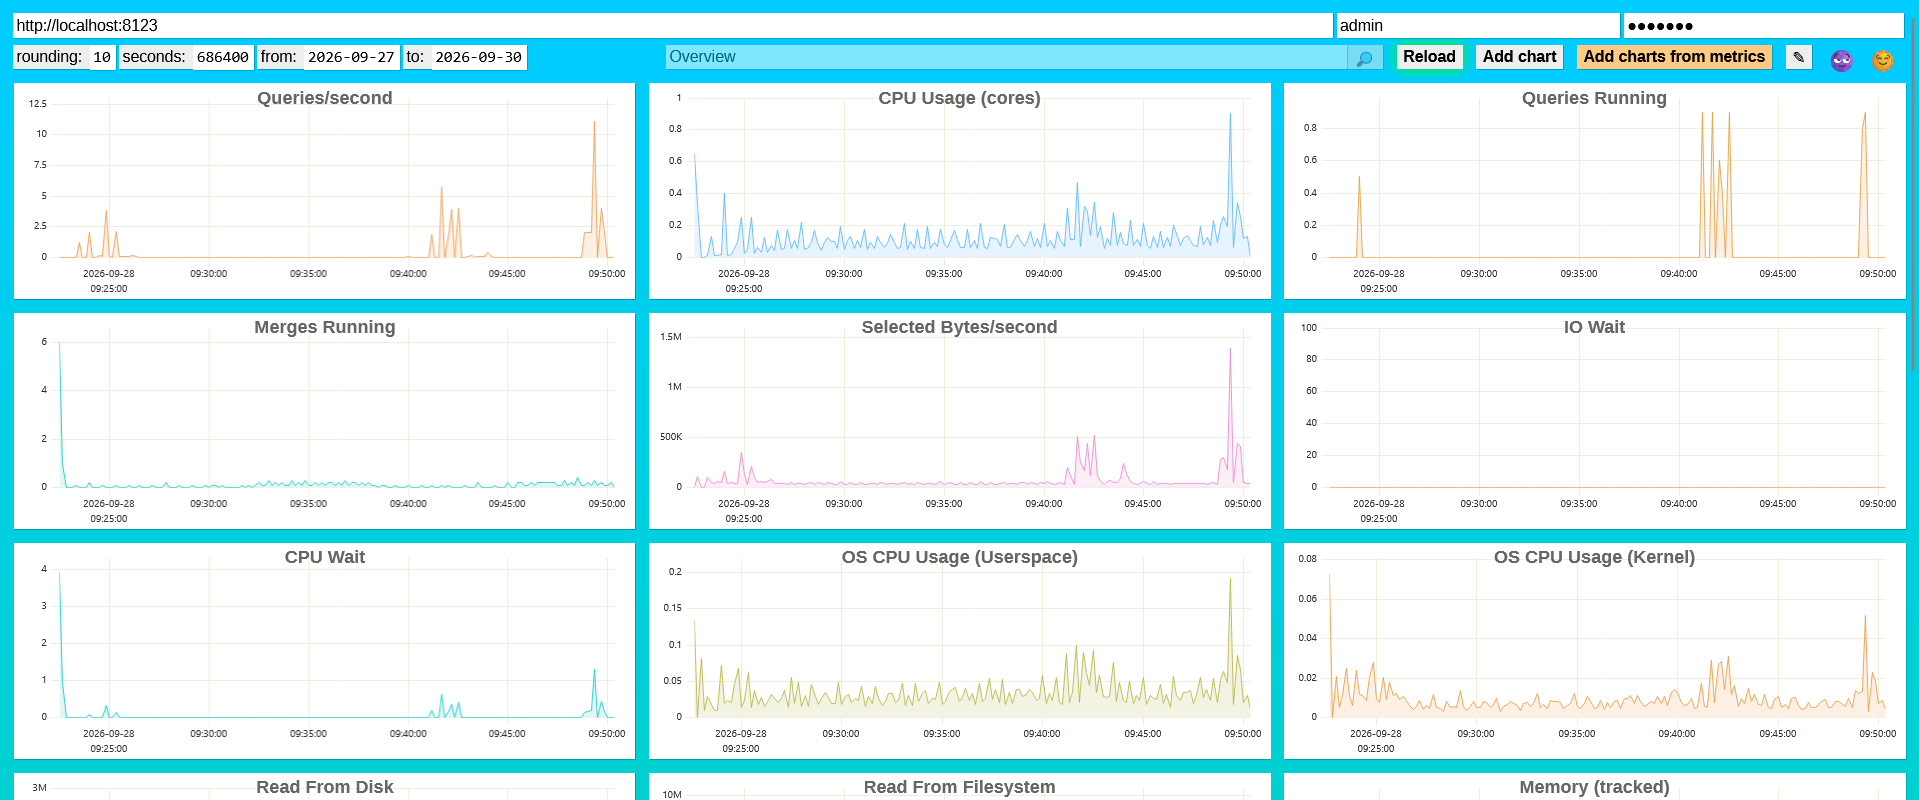
Each Goose session shows up as a small burst of activity, with rows inserted as Jaeger writes to the jaeger database. This is a useful way to confirm that traces are flowing in real time.
Summary
I started off trying to answer a simple question: why did a three-word greeting take 14 seconds to get a response?
From my experiments, it’s clear that when you ask a model a question, the reply looks like a single response but there’s actually a lot going on behind the scenes: the model call, the model’s reasoning steps, the agent’s response processing, the agent’s tool calls, and so on. The Cloudflare test took nearly 49 seconds, with several tool calls and task-list updates before the final answer. Turning on message capture let me read the actual conversation inside each span, including the details of each reasoning step and the extra context Goose added.
If you run AI agents locally, adding tracing is a great way to see why some queries might be slower than others, or to see if changing your prompts can produce faster or better results. If you’re using Goose, OpenTelemetry support is built in. Configure an OTLP endpoint to export telemetry, with message-content capture available separately if you need it.