For people suffering from asthma, a peak flow meter makes it easy to monitor lung capacity and understand how changes in weather and season affect their condition. Typically, this information is stored as discrete readings in an “asthma diary”.
The problem with a paper diary, though, is that as the number of readings increases, so does the difficulty of analyzing them in a holistic way. To make this easier, I decided to build a simple cloud application to both record meter readings electronically and provide visualization tools to make analysis as simple as a one-button click.
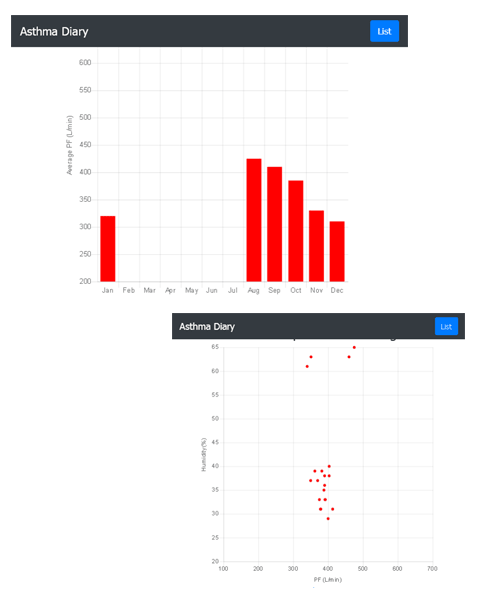
My “cloud asthma diary” allows users to input and save peak flow meter readings into an online application. Each time a reading is added, the application automatically retrieves current external weather conditions, such as temperature and humidity, and enhances the reading with this additional metadata. Users can see visualizations of the saved data, such as a bar chart of peak flow averages grouped by month, or a scatter plot of peak flow values versus temperature.
Here are examples of graphs generated by the application. The first shows changes in peak flow readings by month, while the second correlates readings with external humidity.
The application uses the IBM Cloud Cloudant service to save readings to a Cloudant database in the cloud and the IBM Cloud Weather Company service to retrieve current weather data. It also uses the Slim PHP micro-framework to process requests, Bootstrap and Twig to create a mobile-optimized user experience, Guzzle for API operations, and Chart.js to create charts and graphs from the saved data.
If this sounds like something that would help you better understand and manage your own asthma, you can download the code from GitHub and then read my IBM Developer article for details on how to deploy and use it. And if you’d like to customize it - for example, if you’d like to add extra metadata or create additional types of charts - ping me on GitHub or submit a pull request with your changes.